
23.07.2026
Levelized Cost of Hydrogen (LCoH): Reducing Green Hydrogen Production Costs
Key Takeaways
- This article is based on Ricardo Andrés Mendoza Chávez's Master's thesis at KTH Royal Institute of Technology, completed in collaboration with Stargate Hydrogen.
- The research shows that operational strategy can be just as important as hardware selection when designing a competitive green hydrogen project.
- The Levelized Cost of Hydrogen (LCoH) is influenced by far more than electricity prices.
- Smart dispatch optimisation reduced the Levelized Cost of Hydrogen (LCoH) by around 40% in Sweden's northern electricity zones.
- Optimised operation eliminated approximately 93% of cold starts, extending stack lifetime without requiring battery storage.
- RFNBO compliance increased the Levelized Cost of Hydrogen (LCoH) by approximately €0.32 to €0.33 per kilogram under monthly matching conditions.
The Levelized Cost of Hydrogen (LCoH) Is More Than a Cost Calculation
When people discuss green hydrogen economics, one number almost always dominates the conversation: the Levelized Cost of Hydrogen (LCoH).
It has become the industry's preferred way to compare projects, technologies, and investment opportunities.
Yet many discussions simplify the calculation to one question: "How cheap is electricity?"
Electricity is undeniably the largest operating expense for an electrolyser. However, as the research demonstrates, the Levelized Cost of Hydrogen (LCoH) depends on a much broader set of technical and operational decisions.
Ricardo's research develops a detailed techno-economic model of a 1.2 MW pressurised alkaline electrolyser based on the Stargate Hydrogen Gateway 200 specifications. The model evaluates how dispatch optimisation, stack degradation, RFNBO compliance and battery storage influence production costs across Sweden's four electricity bidding zones.
The outcome is an important message for hydrogen developers:
Lower hydrogen costs are achieved through intelligent system operation, not simply by finding cheaper electricity.
What Is the Levelized Cost of Hydrogen (LCoH)?
The Levelized Cost of Hydrogen (LCoH) is the average cost of producing one kilogram of hydrogen over the lifetime of a project.
Instead of looking at one year's operating expenses, it combines the entire economic picture, including:
- Capital investment
- Electricity costs
- Operations and maintenance
- Stack replacement
- Financing costs
- Total hydrogen production over the project lifetime
This creates a single metric that allows different hydrogen production projects to be compared fairly.
Because the Levelized Cost of Hydrogen (LCoH) accounts for both capital and operating expenses, it has become one of the most widely used indicators for evaluating electrolyser projects.
Yet the research shows that many traditional calculations overlook one important reality: How an electrolyser runs directly impacts its long-term economics.
Why Electricity Price Is Only Part of the Story
Electricity typically represents the largest variable expense in hydrogen production. Previous industry studies have estimated that it can account for between 40% and 70% of the total Levelized Cost of Hydrogen (LCoH) for grid-connected electrolysers.
This naturally encourages operators to purchase electricity whenever prices are lowest. On paper, that sounds straightforward. In practice, continuously switching an electrolyser on and off introduces another cost that is often ignored. Every shutdown and restart contributes to stack degradation.
Frequent cycling shortens stack lifetime, increases replacement costs, and ultimately raises the Levelized Cost of Hydrogen (LCoH) even if electricity purchases become cheaper.
This trade-off sits at the center of Ricardo's research. Rather than treating electricity prices and equipment lifetime as separate topics, the thesis evaluates how they influence each other throughout the life of a hydrogen production asset.
Building a More Realistic Model
To study these interactions, the research’s author developed an integrated techno-economic model that combines several elements rarely analysed together:
- Hourly Nord Pool electricity prices from 2025
- Four Swedish electricity bidding zones
- Mixed Integer Linear Programming (MILP) dispatch optimisation
- Stack degradation modelling
- RFNBO monthly matching requirements
- Battery Energy Storage System (BESS) integration
- Complete Levelized Cost of Hydrogen (LCoH) calculations
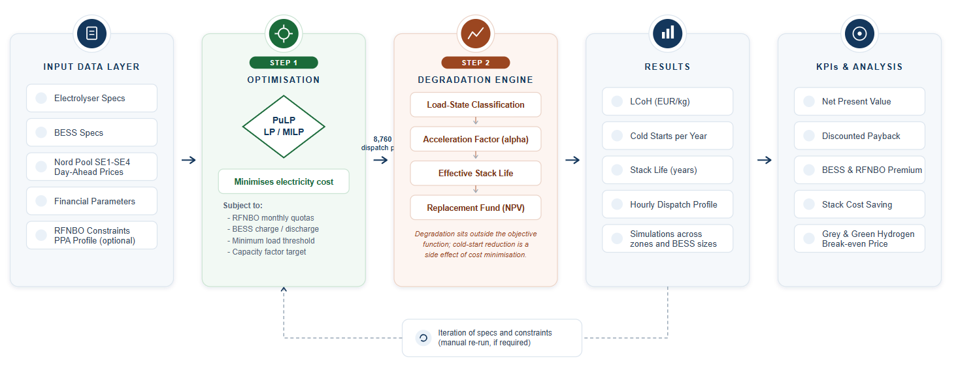
Figure 1. Ricardo Mendoza's optimisation framework combines electricity market data, stack degradation modelling, financial analysis, and dispatch optimisation into a single Levelized Cost of Hydrogen (LCoH) model. Adapted from Ricardo's KTH Master's Thesis.
Instead of assuming the electrolyser operates continuously, the model optimises 8,760 hourly dispatch decisions across a full calendar year.
Each dispatch strategy influences:
- Electricity expenditure
- Hydrogen production
- Stack wear
- Future replacement costs
- Overall project profitability
This creates a much more realistic picture of how industrial electrolysers perform under actual market conditions.
Six Scenarios That Tell the Full Story
The thesis compares six operating scenarios, each designed to isolate the impact of a specific operational strategy.
These include:
- Static operation with a fixed electricity price
- Simple price-following dispatch
- MILP-optimized dispatch
- MILP optimization with RFNBO compliance
- MILP optimization with battery storage
- Fully integrated optimisation combining dispatch, RFNBO compliance and BESS
This structured comparison makes it possible to identify which improvements deliver the greatest reduction in the Levelized Cost of Hydrogen (LCoH).
One finding quickly stands out. The biggest gains do not come from adding more equipment. They come from operating existing equipment more intelligently.
Primary Scenario Matrix:
| ID | Name | Engine | BESS | RFNBO | Energy Constraint |
| S1 | Static Baseline | Static | No | No | Fixed CF = 90\% |
| S2 | Dynamic Dispatch | Dynamic | No | No | Percentile threshold |
| S3 | MILP Optimised | MILP | No | No | Annual floor 90\% CF |
| S4 | MILP + RFNBO | MILP | No | Yes | Monthly equality at 90\% CF |
| S5 | MILP + BESS | MILP | Yes | No | Annual floor 90\% CF |
| S6 | MILP + BESS + RFNBO | MILP | Yes | Yes | Monthly equality at 90\% CF |
Table 1. The six operating scenarios analysed in the research, from static operation through fully optimised dispatch with RFNBO compliance and battery storage. Adapted from Mendoza's thesis.
Dispatch Optimisation Delivered the Largest Cost Reduction
One of the most striking findings is the impact of optimisation alone. Compared with the static operating strategy, the optimised dispatch reduced the Levelized Cost of Hydrogen (LCoH) by approximately 40% in Sweden's northern electricity zones.
The optimised system achieved production costs of approximately:
- €3.06/kg in SE1
- €3.07/kg in SE2
- €4.56/kg in SE3
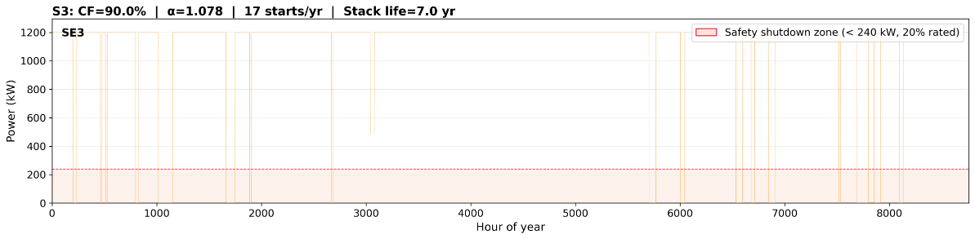
Figure 2. MILP-optimized electrolyser dispatch over time. The optimisation schedules hydrogen production during lower-cost electricity periods while reducing unnecessary shutdowns and restarts.
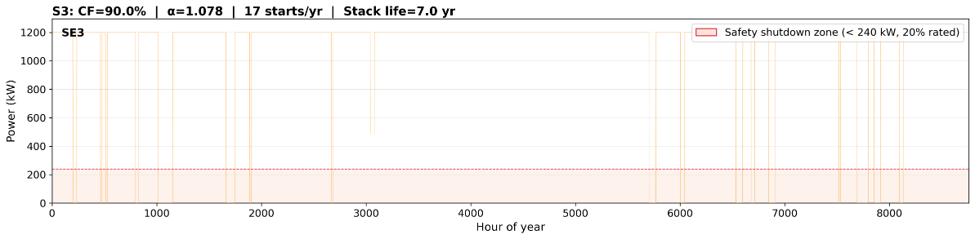
Figure 3. Optimised dispatch schedules produced by the MILP model illustrate how the electrolyser shifts production to lower-cost hours while maintaining operational constraints.
These improvements were achieved without adding battery storage. Instead, the optimisation algorithm determined when the electrolyser should operate while balancing electricity prices with operational constraints. This proves an important lesson for project developers: Sophisticated operational control can deliver savings comparable to major hardware investments.
The Hidden Cost of Cold Starts
The research also highlights an issue that receives far less attention than electricity prices: Cold starts.
Every time an alkaline electrolyser shuts down completely before restarting, thermal and mechanical stresses accelerate stack degradation.Each cold start event consumes stack life equivalent to roughly 60 hours of normal continuous operation, meaning a single restart can undo days of careful operation. A simple strategy that follows electricity prices without considering equipment health may appear economical over a few weeks. Over several years, it becomes much more expensive.
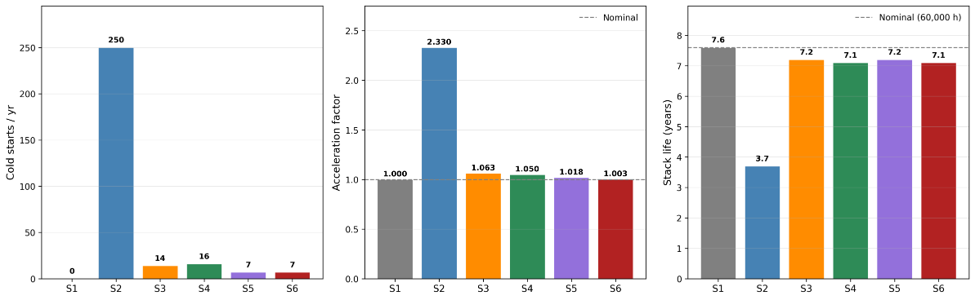
Figure 4. Dispatch strategy has a major influence on stack degradation. Optimised operation dramatically reduces equipment wear compared with simple price-following dispatch. Adapted from Mendoza's thesis.
Ricardo's optimisation model reduced cold starts by approximately 93% compared with a simple price-following strategy. That improvement allowed stack lifetime to return close to its nominal design life without requiring additional battery storage.
This finding has two important implications:
- First, dispatch optimisation lowers electricity costs.
- Second, it reduces future capital expenditure by delaying expensive stack replacements.
Both effects contribute directly to lowering the Levelized Cost of Hydrogen (LCoH).
RFNBO Compliance Has a Measurable Cost
Producing renewable hydrogen in Europe requires compliance with the Renewable Fuels of Non-Biological Origin (RFNBO) framework. These rules govern how renewable electricity must be matched with hydrogen production.
Rather than estimating compliance costs, the thesis incorporates the regulatory requirements directly into the optimisation model.
The results show that monthly RFNBO matching increased the Levelized Cost of Hydrogen (LCoH) by approximately €0.32 to €0.33 per kilogram across Sweden's electricity zones.
| Metric | SE1 | SE2 | SE3 | SE4 |
| S3 LCoH (EUR/kg) | 3.070 | 3.060 | 4.560 | 5.300 |
| S4 LCoH (EUR/kg) | 3.400 | 3380 | 4890 | 5630 |
| RFNBO premium (EUR/kg) | +0.330 | +0.320 | +0.330 | +0.330 |
| S3 Cold starts/yr | 15 | 15 | 14 | 13 |
| S4 Cold starts/yr | 13 | 14 | 16 | 14 |
| S3 α | 1.067 | 1.069 | 1.063 | 1.058 |
| S4 α | 1.000 | 1.031 | 1.050 | 1.047 |
| S3 Stack cost (EUR/yr) | 70,293 | 70,386 | 70,057 | 69,832 |
| S4 Stack cost (EUR/yr) | 43,783 | 68,270 | 69,388 | 69,188 |
Table 2. Additional production cost associated with RFNBO monthly matching requirements across Swedish electricity zones. Adapted from Ricardo's thesis.
While this represents an additional cost, the research also demonstrates that intelligent dispatch remains capable of producing competitive hydrogen under the current regulatory framework.
For project developers, this means regulatory compliance should be integrated into project design from the beginning instead of being treated as an afterthought.
Battery Storage Is Not Equally Valuable Everywhere
Battery Energy Storage Systems are often presented as a universal solution for renewable hydrogen production. The research paints a more balanced picture.
The difference between the two markets becomes clear in the figures below. Both show the electrolyser operating with battery storage and RFNBO compliance, but the battery behaves differently in each case. In SE1, where electricity prices are relatively stable, the battery mainly helps smooth operation and supports monthly energy matching. In SE3, where prices change much more throughout the day, the battery shifts more energy and helps avoid unnecessary shutdowns and restarts. This shows that the value of battery storage depends on the electricity market, not just the battery itself.
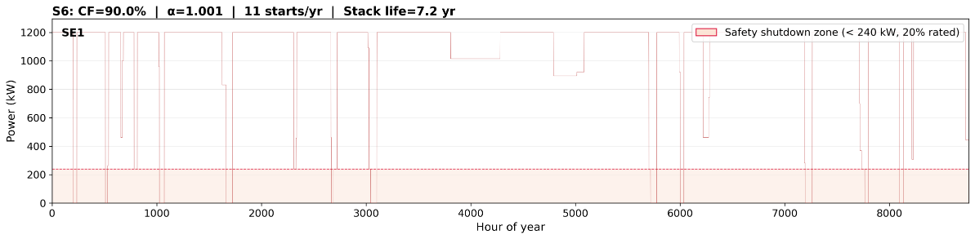
Figure 5. MILP-optimized dispatch with BESS and RFNBO compliance in SE1. The battery primarily smooths electrolyser operation and supports monthly energy matching in a relatively stable electricity market.
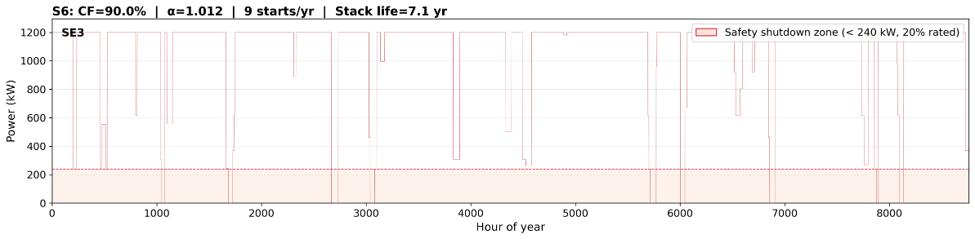
Figure 6. MILP-optimized dispatch with BESS and RFNBO compliance in SE3. Greater electricity price volatility increases the operational value of battery storage by reducing cycling and shifting consumption away from expensive hours while maintaining RFNBO compliance.
Battery storage provides different benefits depending on local electricity market conditions. In northern Sweden, where electricity prices are relatively stable, BESS mainly smooths operation and helps satisfy RFNBO requirements.
In southern Sweden, where prices fluctuate much more dramatically, battery storage provides additional value by protecting the electrolyser from excessive cycling while reducing exposure to expensive electricity.
In other words: The value of battery storage increases alongside electricity market volatility.
This finding reinforces the importance of evaluating battery investments on a project-specific basis rather than assuming every hydrogen project requires identical storage capacity.
Sweden's Electricity Zones Tell Very Different Economic Stories
One of the strengths of the thesis is its comparison across Sweden's four electricity bidding zones.
| Scenario | SE1 | SE2 | SE3 | SE4 |
| S1 (Static) | 5.100 | 5.100 | 5.100 | 5.100 |
| S2 (Dynamic Price-Following) | 3.100 | 3.090 | 4.680 | 5.360 |
| S3 (Optimized Dispatch) | 3.070 | 3.060 | 4.560 | 5.300 |
| S4 (Optimized + RFNBO) | 3.400 | 3.380 | 4.890 | 5.630 |
| S5 (Optimized + BESS) | 3.430 | 3.430 | 4.740 | 5.300 |
| S6 Fully Integrated (+BESS+RFNBO) | 3.670 | 3.650 | 4.990 | 5.640 |
Although the same electrolyser technology is evaluated throughout the study, the economics change considerably depending on location.
Northern Sweden benefits from:
- Lower average electricity prices
- Greater renewable generation
- More stable market conditions
- Lower Levelized Cost of Hydrogen (LCoH)
Southern Sweden experiences:
- Higher electricity prices
- Greater market volatility
- Increased stack degradation under simple dispatch strategies
- Higher production costs
The viability analysis reflects these differences.
According to the research:
- SE1 and SE2 achieved break-even below approximately €3.70/kg.
- SE3 represented a transition zone approaching break-even near €5.00/kg under the fully integrated scenario.
- SE4 required hydrogen prices above approximately €5.30/kg to achieve profitability.
For investors, this demonstrates that project location has a direct influence on the long-term Levelized Cost of Hydrogen (LCoH) and overall financial performance.
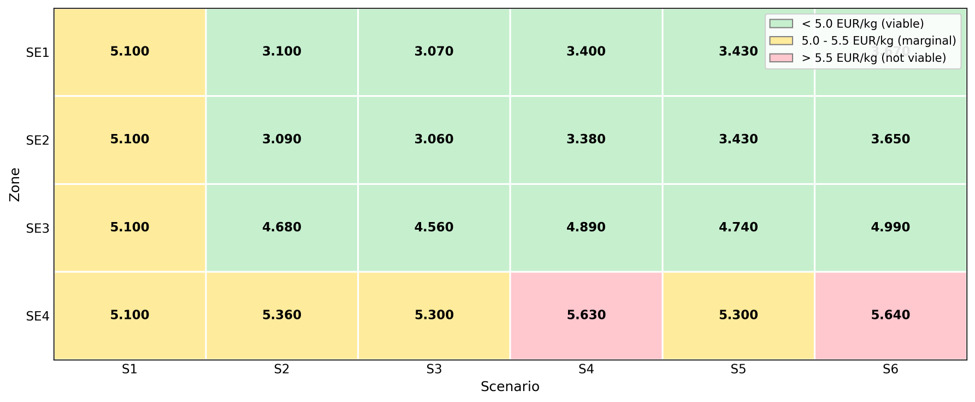
Figure 7. Break-even hydrogen selling price for each operating scenario across Sweden's four electricity bidding zones. Lower break-even prices indicate more economically competitive hydrogen production.
The financial impact of the different operating strategies becomes even clearer when looking at project profitability. Figure 6 below compares the Net Present Value (NPV) across a range of hydrogen selling prices for each scenario. As expected, higher hydrogen prices improve project returns, but the optimised scenarios consistently achieve positive NPV at lower selling prices than the simpler operating strategies.
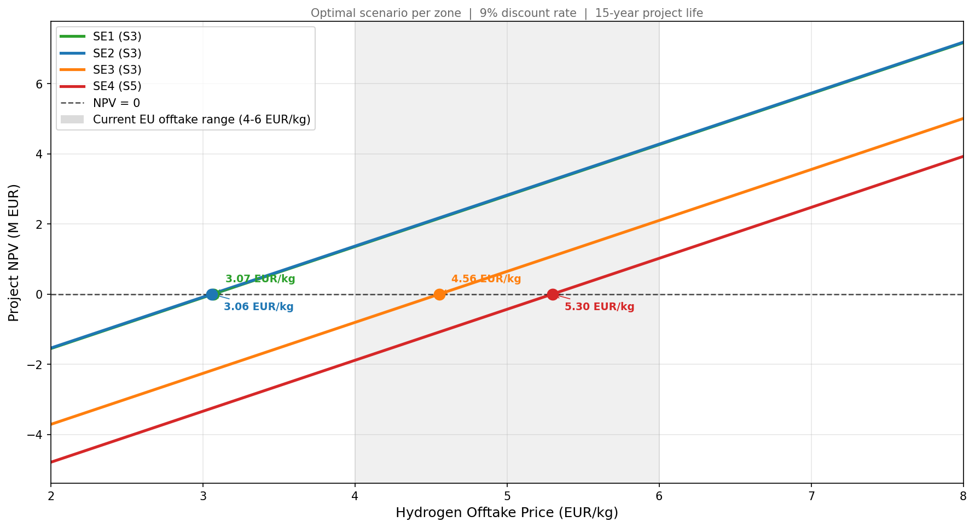
Figure 8. Project Net Present Value (NPV) at different hydrogen selling prices for each operating scenario. The optimised scenarios become profitable at lower hydrogen prices than the simpler operating strategies.
This shows that improving how an electrolyser is operated can have just as much influence on project economics as changes in the market price of hydrogen.
What This Means for Hydrogen Project Development
Perhaps the most valuable contribution of the research is that it changes how project economics should be evaluated. Traditionally, discussions around hydrogen projects often focus solely on selecting the right electrolyser. The research suggests that operational strategy deserves equal attention.
Project developers should evaluate:
- How dispatch optimisation will be implemented.
- How stack degradation will be monitored.
- Whether battery storage creates sufficient economic value.
- How RFNBO compliance influences operating schedules.
- Which electricity market offers the strongest long-term economics.
Each of these decisions affects the Levelized Cost of Hydrogen (LCoH).
Together, they decide whether a project stays competitive over its entire lifetime.
Turning Research into Better Hydrogen Projects
The research shows that achieving a competitive Levelized Cost of Hydrogen (LCoH) is not simply about reducing electricity costs.
It requires balancing market prices, operational flexibility, stack lifetime, regulatory compliance, and investment decisions within a single optimisation framework.
Compare hydrogen production costs across operating strategies, based on real 2025 Nord Pool hourly electricity prices using Stargate’s LCoH Calculator.
For EPC companies, industrial developers, and project investors, this is an opportunity to improve project economics without fundamentally changing the underlying electrolyser technology.
At Stargate Hydrogen, we work to turn advanced engineering research into practical hydrogen production solutions. Whether you're evaluating a new electrolyser project, assessing RFNBO compliance, or looking for ways to lower your Levelized Cost of Hydrogen (LCoH), our team can help you find the operational strategies that make the biggest difference.
Get in touch with Stargate Hydrogen to learn how our electrolyser technology and engineering expertise can support your next green hydrogen project.